XLIDE
XLIDE
DEVELOPMENT OF TOOLS FOR ANALYTICS OF STABILITY IN SLOPES WITH HIGH POTENTIAL RISK FOR CRITICAL INFRASTRUCTURES
PARTNERS: OFITECO S.A., CIMNE, Universidad Politécnica de Madrid (ETSICCP), Instituto de Geomática
The main objective of the Project is to develop tools to analyze and control the safety level of critical infrastructures facing the instability of surrounding slopes. The issue is to add new monitoring techniques, advanced numerical models and modern methods of interpretation, so to create synergies between these three factors in order to develop a tool including the latest advances in the three fields.
A critical infrastructure is as structure with a high potential risk, and whose wrong operation could result into human casualties and important economical losses, such as roads, railways and power stations, among others. Dams constitute a relevant case, because they not only can be affected by the slide itself, but they also by the wave generated in the reservoir.
The phenomenon is very complex, because it involves different physical mechanisms, both geotechnical and hydraulic, all of them hard to characterize. The origin is the slide of the slope, event with a varied casuistry, depending on the type of terrain, the slope, the triggering event, etc.
The first consequence of a sudden slide in the slope of a reservoir (if the reservoir has a certain water level) is the formation of a wave which characteristics (amplitude, wavelength) depend on diverse factors, not only on the slides nature (material volume, density, velocity), but also on the reservoir's water level and the geometry.
The generated wave could also produce two kinds of damages. First of all, the damage caused in the goods and populations existing in the slopes of the reservoir, and second, the possible dam overtopping with the subsequent risk for villages downstream, even if the dam suffers no damage. One of the most well-known landslides in dams happened in Vaiont (Italy). The pictures shown bellow permit to figure the real seriousness of the event. Despite the dam stood almost intact, the huge wave that overtopped the dam caused over 2.000 deaths in several villages downstream.

Figure 1: Picture taken in Mount Toc by E. Semeza on 1959 September the first. The bottom line shows the existing paleoslide and the one on the top the 1963 slide limit.
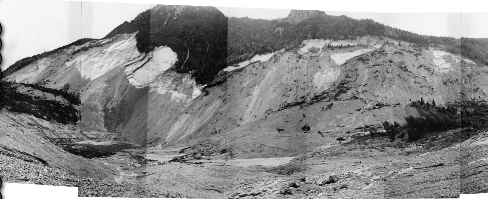
Figure 2: Same view taken by Daniele Rossi at the end of 1963, after the disaster.
Figure 3: Numerical simulation of Vajont landslide. Water Blue, landslide red.
Figure 4: Numerical simulation of Lituya landslide
 Este proyecto ha sido cofinanciado por el Ministerio de Economía y Competitividad, en el marco del Plan Nacional de Investigación Científica, Desarrollo e Innovación Tecnológica (2008-2011). Programa Nacional de Cooperación Público-Privada. Subprograma INNPACTO (IPT-2011-1287-370000).
Related items
-
09/02/2015ALCON DEVELOPMENT OF DESIGN CRITERIA TO INCREASE THE DISCHARGE CAPACITY IN GRAVITY DAMS USING SPI...
-
09/02/2015POLILAB DEVELOPMENT OF A LABYRINTH-SHAPED GATE IN ORDER TO INCREASE THE SPILLWAYS CAPACITY PAR...
-
08/09/2014ACUÑA DEVELOPMENT OF METHODOLOGY FOR THE DESIGN OF SPILLWAYS USING WEDGE-SHAPED BLOCKS OVER ...
-
30/05/2014BALAMED DEVELOPMENT OF TOOLS BASED ON THE DISCRETE ELEMENT METHOD (DEM) FOR SIMULATING THE RESPON...
-
09/04/2014eDAMS EXPERIMENTAL AND NUMERICAL METHODS FOR SAFETY ASSESSMENT AND PROTECTION OF EARTH AND ROCKFI...
-
08/02/2014XLIDE DEVELOPMENT OF TOOLS FOR ANALYTICS OF STABILITY IN SLOPES WITH HIGH POTENTIAL RISK FOR CRIT...
-
14/01/2013SEPRISIS STUDY ON DAM SAFETY AND INDENTIFICATION OF RISK SCENARIOS USING EXPERT SYSTEMS PARTNERS...
-
09/04/2012SAYOM INNOVATIVE SUPPORT SYSTEM FOR PLANNING, CONSTRUCTION AND EXPLOITATION OF MARINE WORKS PART...
-
19/12/2011Acronym: VADIVAP Reference: CIT-460000-2009-5 Title: Estudio de las principales v...


